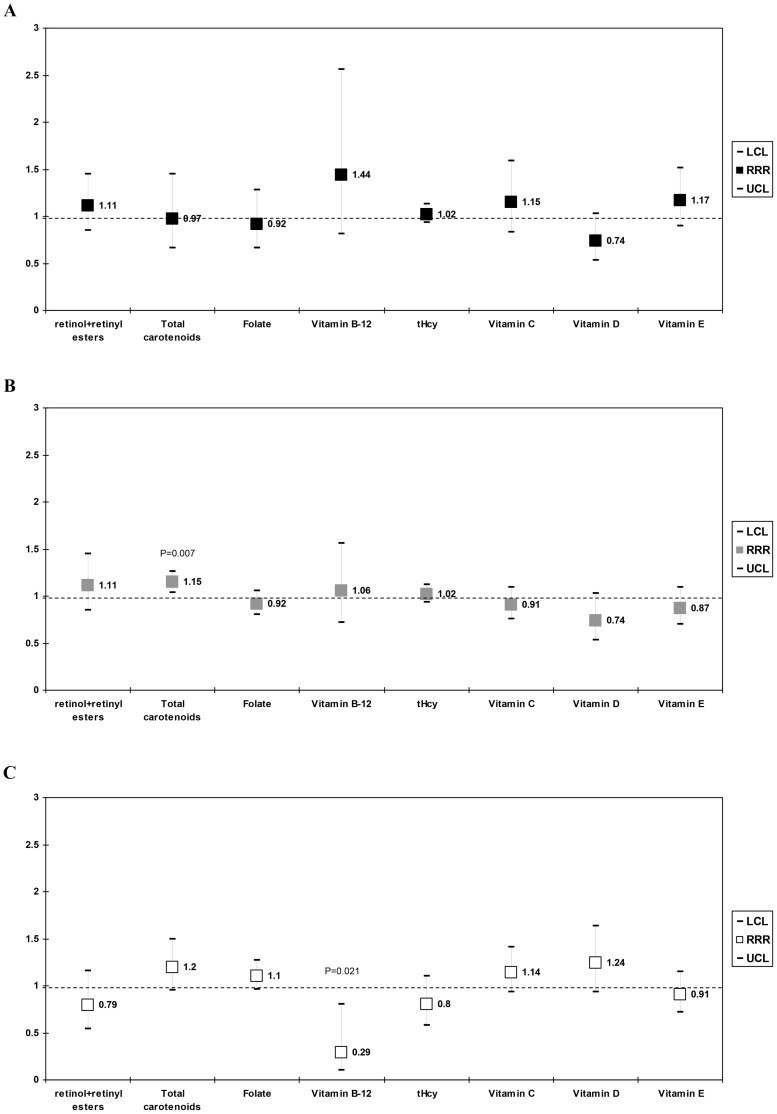
Figure 2. Relative risk ratio (RRR with 95% CI) per 1 SD nutritional biomarker: (A) Very short sleep vs. Normal sleep durationa,b, (B) Short sleep vs. Normal sleep durationa,b, (C) Long sleep vs. Normal sleep durationa,b.
Abbreviations: BMI = Body Mass Index; CI = confidence interval; Met = Metabolic Equivalent; n-3 HUFA = omega-3 highly unsaturated fatty acids; NHANES = National Health and Nutrition Examination Survey; RRR = relative risk ratio; SEE = Standard error of the estimate. a Values are Relative Risk Ratios (RRR) with 95% confidence intervals. Sampling design complexity is taken into account in all analyses. b Models included all serum nutritional biomarker exposures simultaneously, and adjusted for socio-demographic factors: age, sex, race/ethnicity, marital status, educational level and poverty income ratio, and other potential confounders: Lifestyle and health-related factors (smoking status, BMI, physical activity: Mets.hr.wk−1, history of selected chronic conditions (i.e. type 2 diabetes, CVD and cancer)), anti-depressant use and dietary intakes (total energy intake, alcohol, caffeine, fiber, n-3 HUFA, each of the five carotenoids, vitamin C, vitamin E, folate, vitamin B-12), fruit and vegetable intake, supplement use, anti-depressant use, and the inverse mills ratio, 2-stage Heckman selection model as well as serum cholesterol (See Table 4 , Model 4 for more details).

