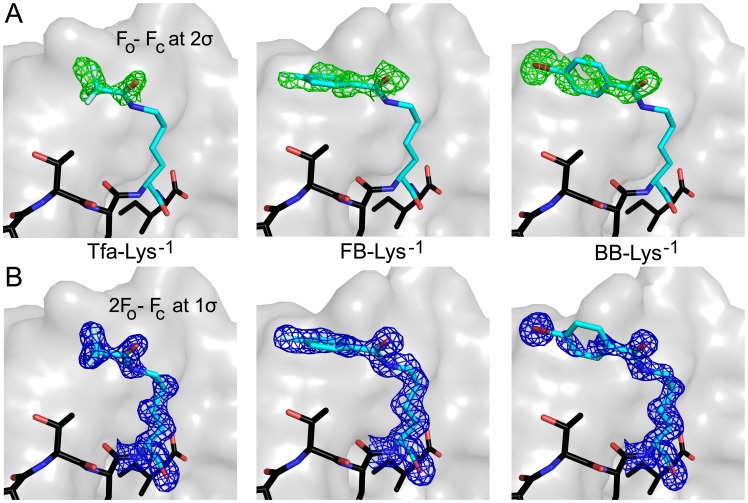
Figure 1. Electron density of chemically modified peptides.
A) Prior to ligand modeling, positive electron density was observed in F O – F C difference maps, as illustrated here (contour level: 2σ) for the halogenated substituents attached to the Lys side chain at P−1. B) After iterative rounds of refinement and model building, final 2F O – F C electron density maps (contour level: 1σ) showed excellent agreement with the model, as shown here for the corresponding P−1 side chains. The final refined peptide structures are shown as stick figures and colored by atom/position (C = light blue for P−1 or black for other positions, O = blue, F = sky blue, N = red, Br = dark red). The van der Waals surface of CALP is shown in gray. The substituents are indicated as follows: Tfa, trifluoroacetic acid; FB, 4-fluorobenzoic acid; BB, 4-bromobenzoic acid.

