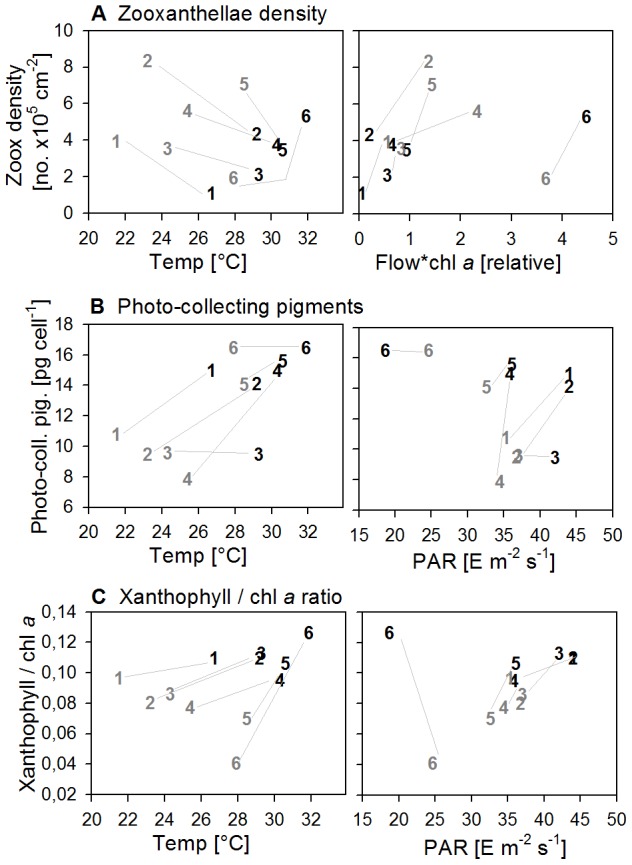
Figure 3. Relationship between environmental parameters and zooxanthellae composition at all sites (1–6) in Sep11 (black) and Mar12 (grey).

Data points represent means (standard errors are listed in table S2). The lines connect the two seasons within each site. Light intensity (PAR) in 5 m depth.
