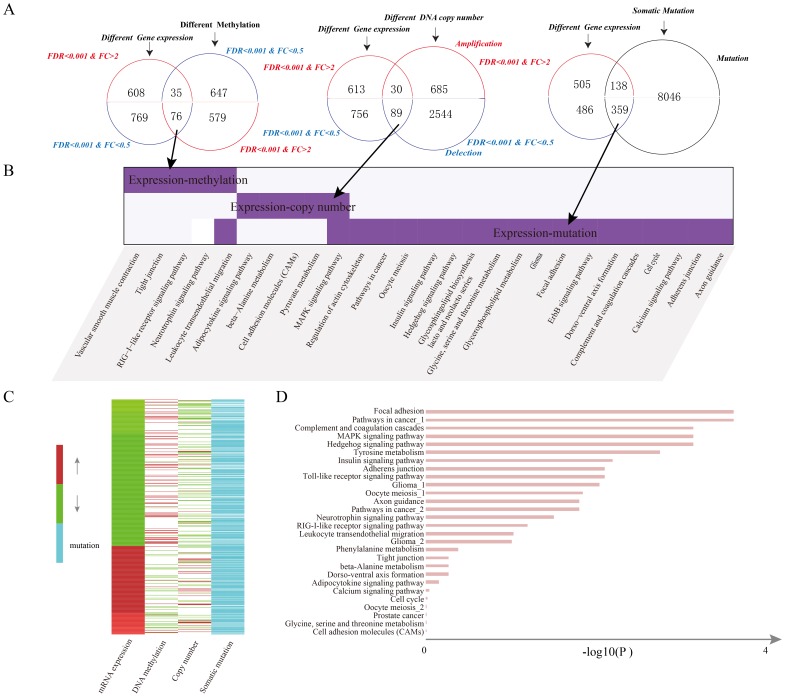
Figure 3. Integrative information of candidate genes with alterations at multiple levels and risk pathways.
(A) Venn diagram showing the dysregulated groups between mRNA expression and another molecular level such as DNA methylation,DNA copy number and somatic mutation. (B) Comparisons among pathways enriched by potential candidate genes derived from different dysregulated groups. (C) The alteration patterns of candidate genes in at least two levels. (D) The significantly enriched risk pathways by candidate genes (FDR<0.05).

