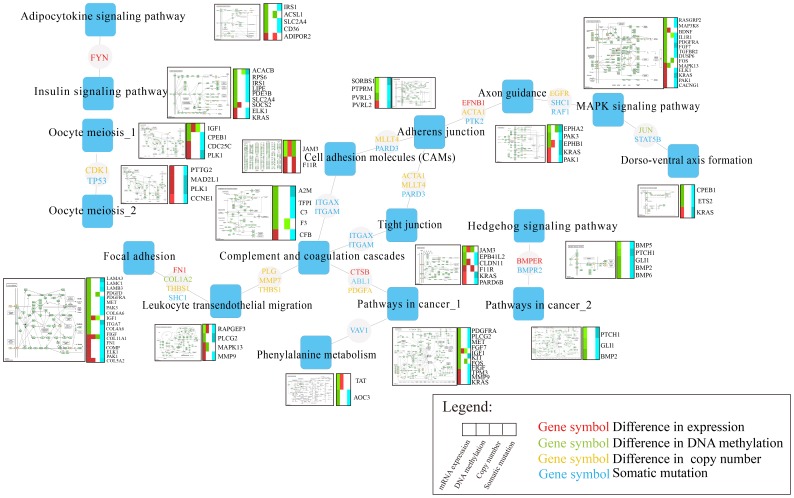
Figure 4. The network of cross-talking pathways.
The cross-talking pathways with the alteration patterns of candidate genes in each risk pathway and linkers mediating cross-talk of pathway pairs are shown. Each square node represents the risk pathway and the circle made of linkers. The different colors of linkers represent the change in different molecular level.

