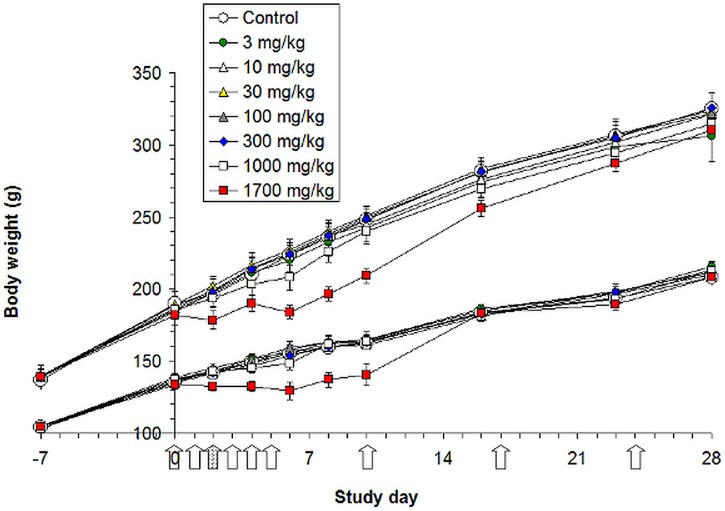
Figure 1. Body weight development of male (upper curves) and female (lower curves) rats.
The arrows indicate dosing. Due to unexpected decrease in body weight at the highest dosage group (1700 mg/kg bw) the third loading dose was omitted (dotted arrow) and the rats of this group received only the corn oil vehicle. After loading dose period the body weight development recovered and body weights were similar at the end of the study. Each data point represents mean ± SE (n = 5).

