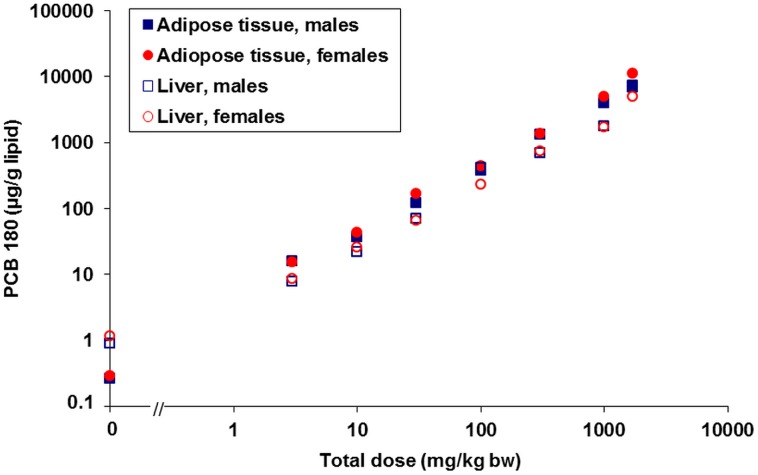
Figure 2. Lipid based adipose tissue and liver PCB 180 concentrations at the end of the study.
Pooled samples of treatment groups (5 individuals per pool), log-log scale. Liver data from Roos et al., 2011 [17]. PCB 180 tissue concentrations reflected accurately the administered doses.

