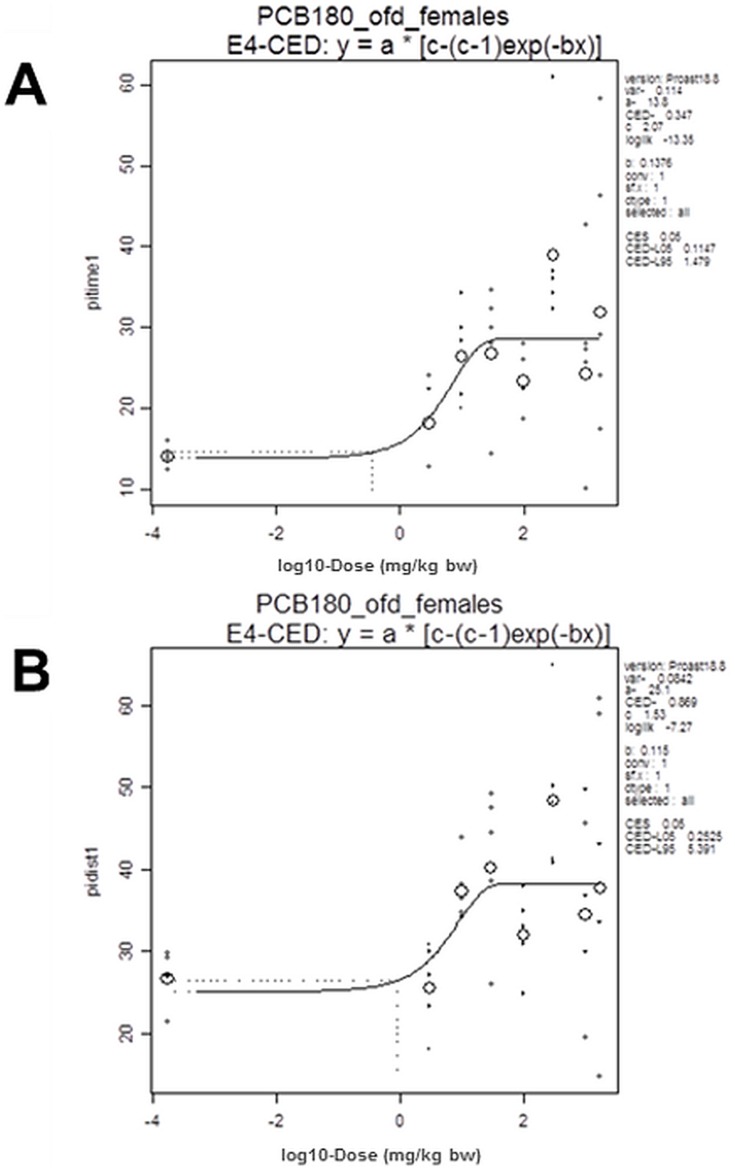
Figure 3. BMD analysis of percentage of time (A) and distance moved (B) in the inner zone of open field.
Time and distance in the inner zone were dose-dependently increased in females on study day 24 (1st test day). Small symbols indicate individual samples, large circles the group mean; the vertical dotted line indicates the dose (CED) with 5% increase (CES -0.05) compared to background (a parameter).

