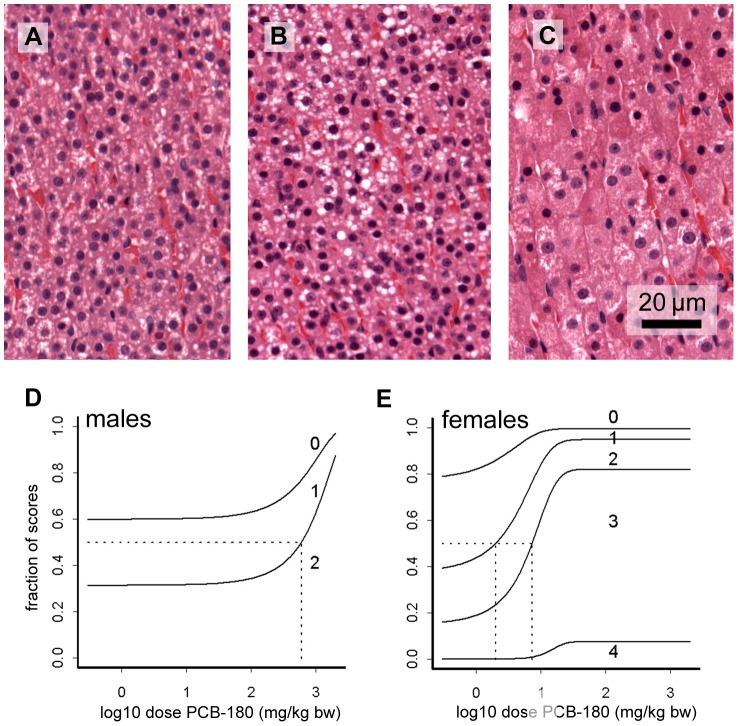
Figure 8. Microphotographs of the adrenal cortex and BMD analysis of zona fasciculata activation.
Two stages of activation of zona fasciculata are shown in comparison with no activation: A, no activation (stage 0, 0 mg/kg bw); B, moderate activation with vacuolization and slight hypertrophy (stage 2, 10 mg/kg bw); C, strong activation with severe hypertrophy (stage 4; 300 mg/kg bw). This staging system was used for semi-quantitative assessment of the population, as shown in the BMD graphs for males (D) and females (E). In these graphs, the lines separate the fractions of the population with the indicated stages of activation, e.g. in control males, similar fractions are at stage 0, 1 and 2, whereas at the highest dose, most samples are at stage 2. Vertical dotted lines show the dose at which the average animal (horizontal dotted line) progresses to a further stage of activation.

