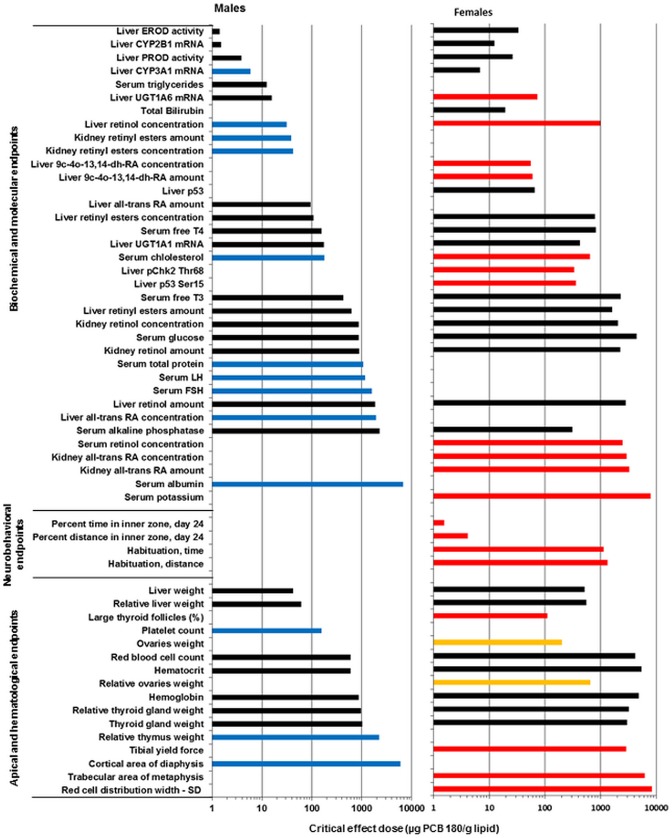
Figure 11. Sensitivity of endpoints showing significant dose-responses in males (left panel) and females (right panel).
Adipose tissue PCB 180 concentration based CED values at CES 5% (shown in log scale) are ranked according to sensitivity in males. Endpoints are grouped into biochemical/molecular endpoints, neurobehavioral endpoints and apical/hematological endpoints. Key: endpoints with significant dose-responses in both genders: black bars; endpoints significant only in males: blue bars; endpoints significant only in females: red bars; endpoints existing only in one gender: yellow.

