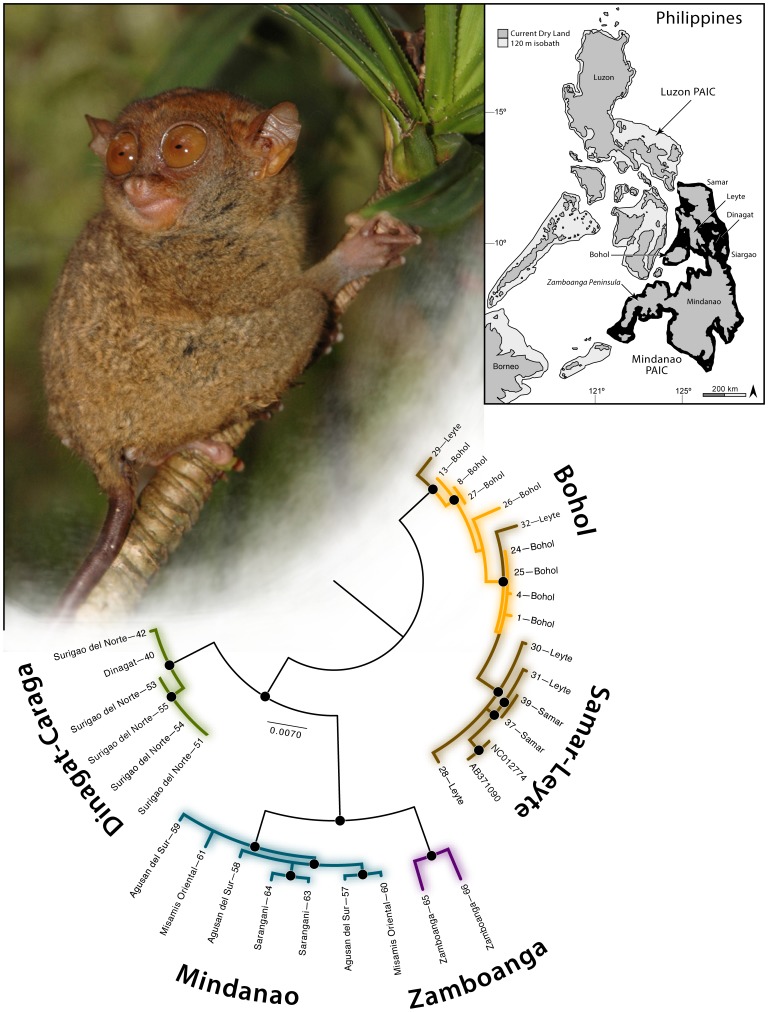
Figure 1. Phylogeographic relationships of Tarsius syrichta (see Appendix S1 for taxonomic summary) estimated from a combined, partitioned, RAxML ML analysis of mitochondrial (12S, CytB, ND2) gene fragments.
Black circles at nodes correspond to ML bootstraps ≥70% and Bayesian PP ≥95%.

