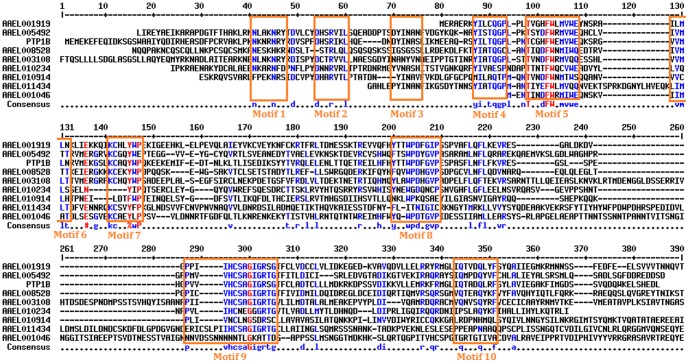
Figure 2. Multiple sequence alignments of the A. aegypti PTP domains with the PTP domain of human PTP1B.
Regions of high sequence similarity (>90\%) are highlighted in red; regions of moderate sequence identity (50–90%) are highlighted in blue. The ten motifs defining a PTP domain are marked in red boxes. These are in accordance with the nomenclature of Andersen et al. [59].

