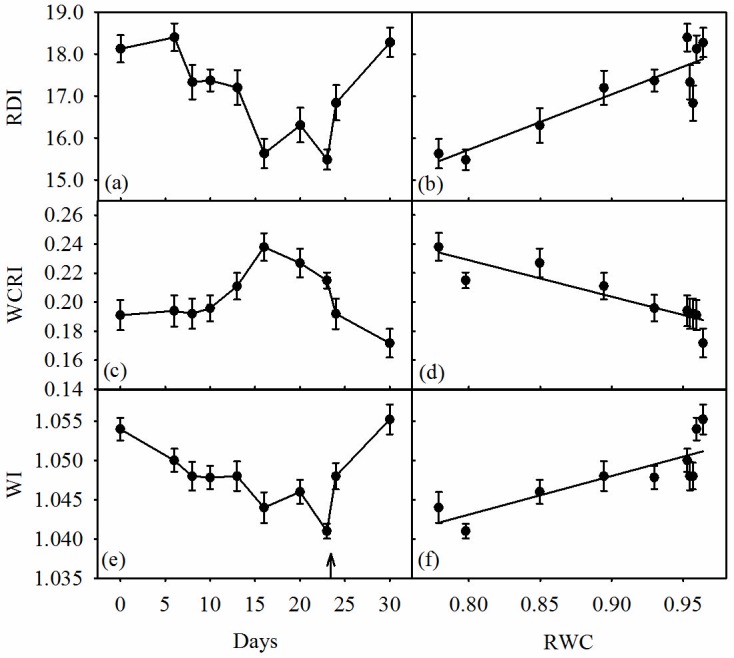
Figure 5. Time courses of (a) relative depth index (RDI), (b) water correlated reflectance index (WCRI) and (c) water index (WI), and relationships between relative water content (RWC) and (d) RDI (r2 = 0.803, P<0.001), (e) WCRI (r2 = 0.814, P<0.001) and (f) WI (r2 = 0.675, P = 0.004) in olive saplings grown during and after the drought cycle (days 1–23). ↑ = end of the drying cycle. Data points are means of five plants (five leaves per plant) per measurement ±1 SEM.

