
Figure 1.
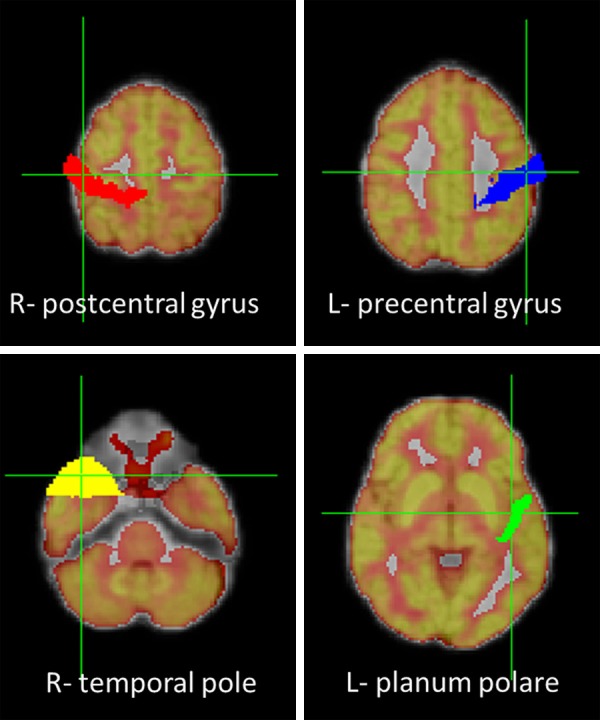
On the FDG-PET and MRI co-registered images, the upper row depicts the masks of right postcentral (red) and left precentral gyri (blue) that show hypermetabolism in epilepsy patients. The lower row depicts the masks of right temporal pole (yellow) and left planum polare (green) that show hypometabolism in epilepsy patients.