
Figure 2. Presence of CD3+IL-17+ T cells and tryptase+IL17+ mast cells in morphea.
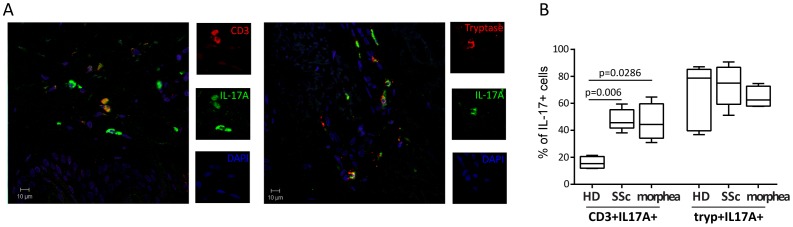
A. Indirect immunofluorescence analysis was used to assess the expression of IL-17A (green), in combination with CD3 (red, left panel) or Tryptase (red, right panel) and DAPI staining of nuclei (blue) in the dermis of a representative of 5 morphea biopsies. Original magnification 40X. B. Box-plots show the quantification of CD3+IL-17A+ and Tryptase+IL-17A+ cells expressed as percentage of total IL-17A+ cells in 4 HD, 4 SSc and 4 morphea skin section. The box represents values between 25th and 75th percentile with a line at the median (50th percentile). The whiskers extend above and below the box to show the highest and the lowest values.