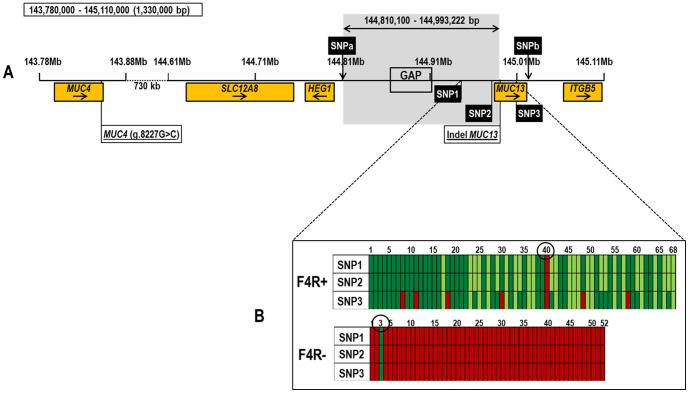
Figure 5. Schematic representation showing the identified candidate region (chr13: 144,810,100-144,993,222) of F4ab/ac ETEC susceptibility between MARC0002946 (SNPa) and Indel MUC13 marker on chromosome 13 (chr13: 143,780,000-145,110,000).
(A) SNP1 (ASGA0089965), SNP2 (ASGA0091537) and SNP3 (ALGA0106330) are the most significant SNPs in the association study. MARC0002946 (SNPa) and ALGA0106230 (SNPb) are not associated with F4ab/ac ETEC susceptibility. The orange boxes represent all the annotated genes in the 1.33 Mb region of chromosome 13. The gray box represent the candidate region where no annotated genes were found during the in silico comparative mapping. (B) Schematic representation showing the genotypes of SNP1 (ASGA0089965), SNP2 (ASGA0091537) and SNP3 (ALGA0106330) of 68 strong adhesive (F4R+) and 52 non-adhesive (F4R−) for F4ab/ac ETEC. For SNP1 and SNP3, the dark green boxes represent CC genotype, light green boxes represent CT genotype and red boxes represent TT genotype. For SNP2, the dark green boxes represent TT genotype, light green boxes represent CT genotype and red boxes represent CC genotype. Pig 40 (F4aR+) and pig 3 (F4R−) show different genotypes for the markers than expected.

