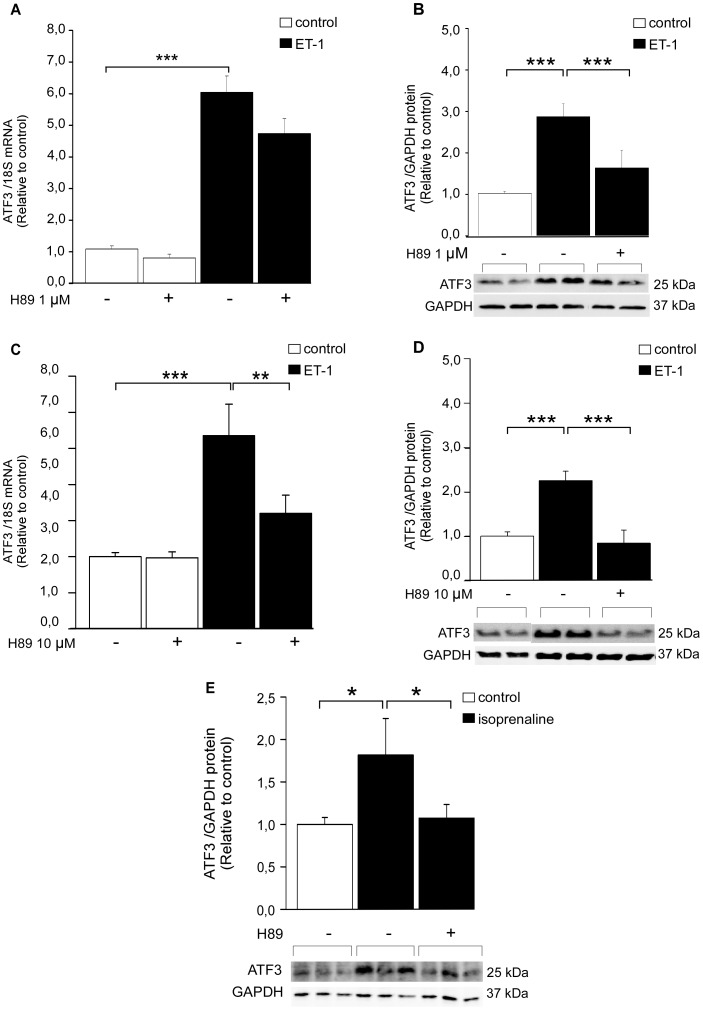
Figure 3. PKA inhibitor H89 inhibits ET-1- and isoprenaline-induced ATF3 increase in NRCM.
Cultured cardiomyocytes were treated for 2 hours with PKA inhibitor H89 (1 µM A, B or 10 µM C, D, E) subsequently the cells were subjected to ET-1 (100 nM, 1 h) or isoprenaline (100 nM, 15 min) stimuli. A, C, ATF3 mRNA levels were determined by qPCR and normalized to 18S quantified from the same samples. The mRNA levels are presented relative to non-stimulated DMSO control cells. The protein levels of ATF3 and GAPDH loading control were detected by Western blotting (B, D, E). Representative Western blots are shown. Bar graphs represent ATF3 protein levels normalized with GAPDH levels and presented relative to control group. Mean ± SEM (n = 5–10) from 3 independent experiments is presented. *P<0.05; **P<0.01.

