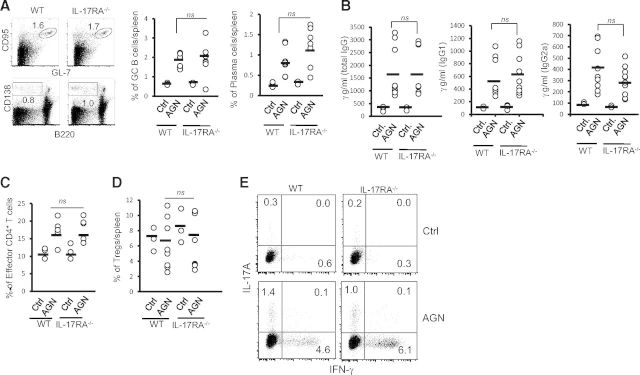
Figure 3. Comparable systemic immune response between C57BL/6 and IL-17RA−/− mice.

(A) Flow cytometric analysis of splenic cells from C57BL/6 (n=9) and IL-17RA−/− (n=10) was performed at Day 14 to determine the frequency of GC B cells (B220+GL-7+CD95+) and plasma cells (B220loCD138hi). Numbers in the dot plot represent percentage of cells. (B) At Day 14, serum titers of mouse anti-rabbit total IgG, IgG1 isotype, and IgG2a isotype were measured by ELISA in C57BL/6 (n=9) and IL-17RA−/− (n=10) mice. Flow cytometric analysis of splenic cells from C57BL/6 (n=9) and IL-17RA−/− (n=10) was performed at Day 14 to determine the frequency of (C) effector CD4+ T cells (CD4+CD62LloCD44hi) and (D) natural Tregs (CD4+CD25+Foxp3+). Each dot represents individual mice, and the horizontal bars indicate mean for each group. Data are pooled from two independent experiments. (E) At Day 14, splenocytes were stimulated with PMA/ionomycin for 4 h and intracellularly stained for IL-17A and IFN-γ, followed by FACS analyses (gated on CD4+ cells). Numbers in the dot plot represent percentage of cells.
