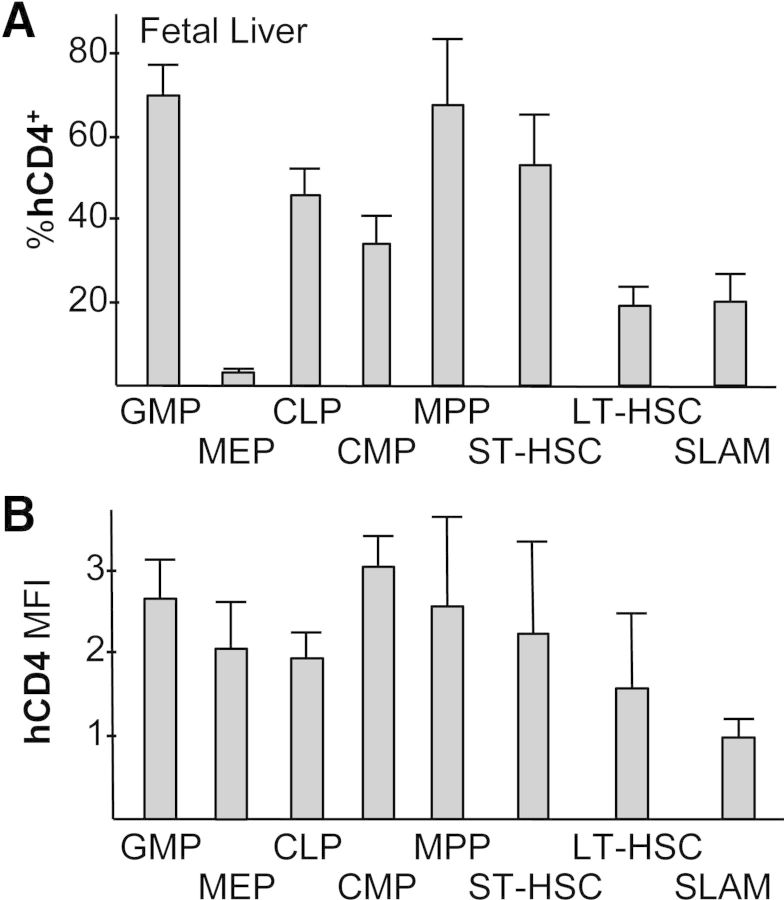
Figure 2. Evaluation of Cebpa-hCD4 transgene expression in FL hematopoietic populations.
(A) E13.5 FL cells from individual embryos were screened for hCD4 expression, and positive embryos were then evaluated for hCD4 expression by FACS as in Fig. 1. The proportion of hCD4+ cells in each subset is shown (n=4–6). (B) The relative MFI for hCD4 expression in hCD4+ cells in the indicated FL populations is shown, with MFI set to 1.0 for LSK/SLAM cells.

