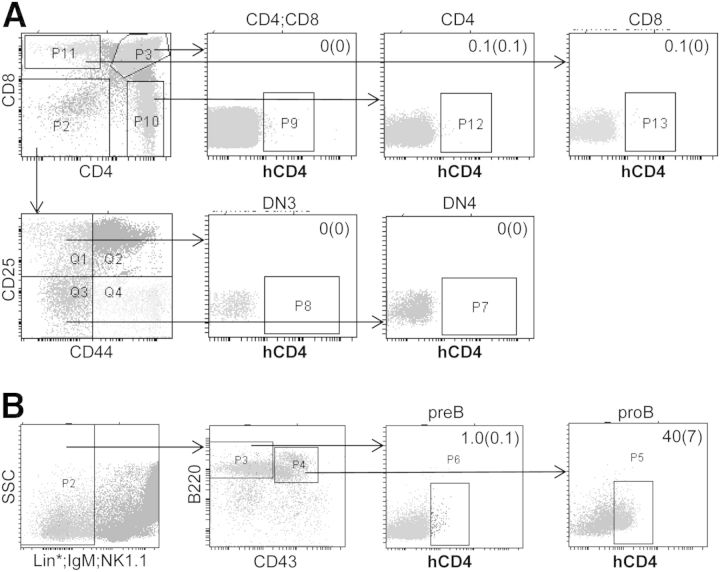
Figure 3. Evaluation of Cebpa-hCD4 transgene expression in thymic T cell and marrow B cell precursors.
(A) Thymic cells from transgenic Line 1 were stained for CD4, CD8, CD25, CD44, and hCD4 and subjected to FACS analysis to identify the CD4+CD8+, CD4+, CD8+, DN3, and DN4 T cell populations. Representative FACS data and the proportion of hCD4+ cells in each subset are shown (mean and sd; n=3). (B) Marrow cells from transgenic Line 2 were stained for Gr-1, Mac-1, CD3, Ter119 (Lin*), IgM, NK1.1, B220, CD43, and hCD4 and subjected to FACS analysis to identify pre-B and pro-B cells. Representative FACS data and the proportion of hCD4+ cells in each subset are shown (mean and sd; n=3). SSC, Side-scatter.

