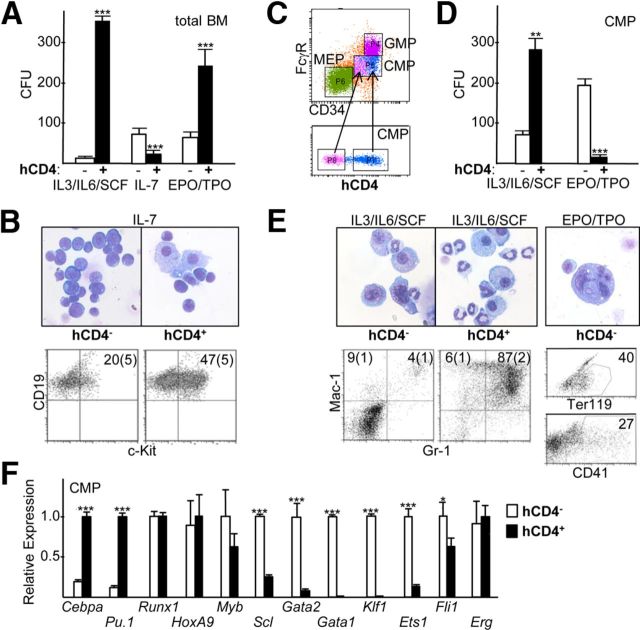
Figure 4. Evaluation of Cebpa-hCD4 transgene expression in myeloid, B lymphoid, and Meg/E CFUs and RNA analysis of hCD4− versus hCD4+ CMP.
(A) Mononuclear marrow cells from transgenic Line 1 were sorted into hCD4− and hCD4+ populations and plated in methylcellulose with IL-3/IL-6/SCF, IL-7, or EPO/TPO. The number of myeloid CFUs obtained/1E4 cells plated and the number of B lymphoid or Meg/E CFUs obtained/2E5 cells plated are shown (mean and sd; n=3). BM, Bone marrow. (B) Morphology and CD19 and c-Kit FACS analysis of pooled CFUs obtained in IL-7 from hCD4− or hCD4+ marrow cells. (C) Marrow mononuclear cells were stained for hCD4, lineage markers, c-Kit, Sca-1, CD34, and FcγR and subjected to FACS analysis. Lin−Sca-1−c-Kit+ cells were gated to allow enumeration of CMP. These were then subdivided into hCD4low (pink) and hCD4hi (blue) subsets, which were then mapped back to the CMP population. Representative FACS data from three independent experiments are shown. (D) hCD4− and hCD4+ CMPs were sorted and plated in IL-3/IL-6/SCF or EPO/TPO, and CFUs were enumerated (n=3). (E) Morphology and Mac-1; Gr-1 FACS (n=3) of pooled CFUs obtained in IL-3/IL-6/SCF from hCD4− or hCD4+ CMP (left). Morphology and Ter119 or CD41 FACS (n=3) of pooled CFUs obtained in EPO/TPO from hCD4− or hCD4+ CMP (right). (F) RNA prepared from hCD4− or hCD4+ CMP was subjected to qRT-PCR for indicated RNAs (n=3). The average level of each RNA was set to 1.0 in the CMP subset with the higher expression. *P < 0.05, **P < 0.01, and ***P < 0.001.

