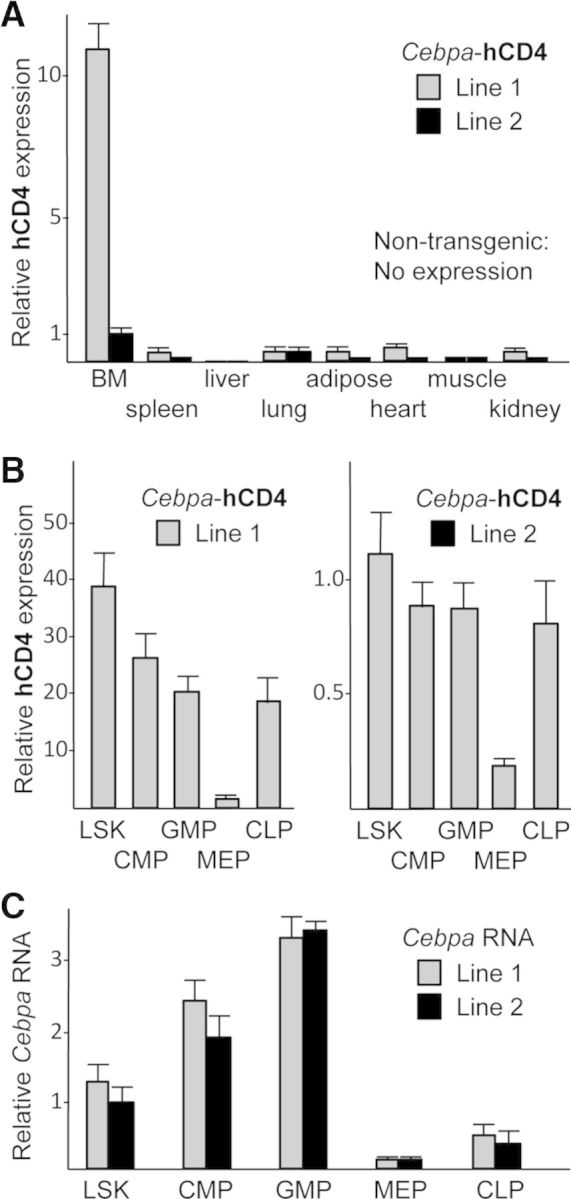
Figure 6. Evaluation of Cebpa-hCD4 transgene RNA expression in nonhematopoietic tissues and in marrow subsets.

(A) Total RNA from bone marrow or from indicated tissues was assessed for hCD4 RNA expression by qRT-PCR, normalized to ribosomal protein S16 RNA expression. Relative hCD4 expression between all samples is shown (n=4 mice/line). (B) Total RNAs from indicated marrow hematopoietic subsets were analyzed similarly. Although plotted separately, relative hCD4 expression for Lines 1 and 2 samples were all compared in simultaneous analyses—note differences on ordinate scale (n=4). (C) These hematopoietic RNA samples were also analyzed for relative endogenous Cebpa RNA expression (n=4).
