
Figure 2.
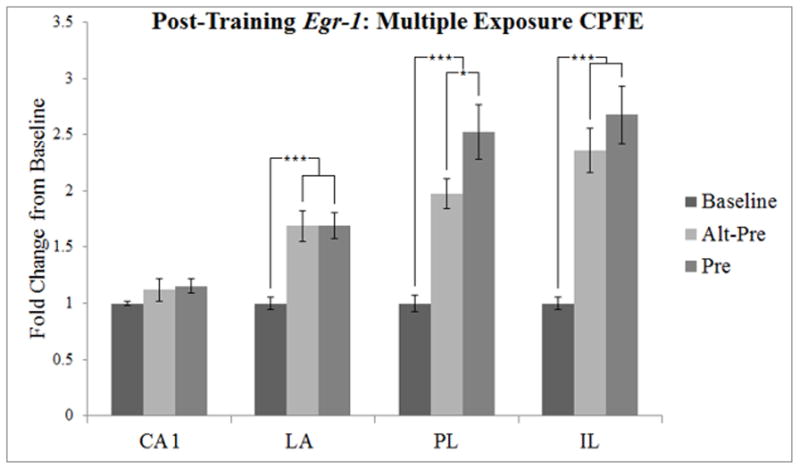
Post-training Egr-1 expression, depicted as a three-group design similar to Asok et al. (2013b). Error bars indicate standard error of the mean. *p < 0.05, *** p < 0.01.
Official websites use .gov
A
.gov website belongs to an official
government organization in the United States.
Secure .gov websites use HTTPS
A lock (
) or https:// means you've safely
connected to the .gov website. Share sensitive
information only on official, secure websites.
Post-training Egr-1 expression, depicted as a three-group design similar to Asok et al. (2013b). Error bars indicate standard error of the mean. *p < 0.05, *** p < 0.01.