
Figure 3.
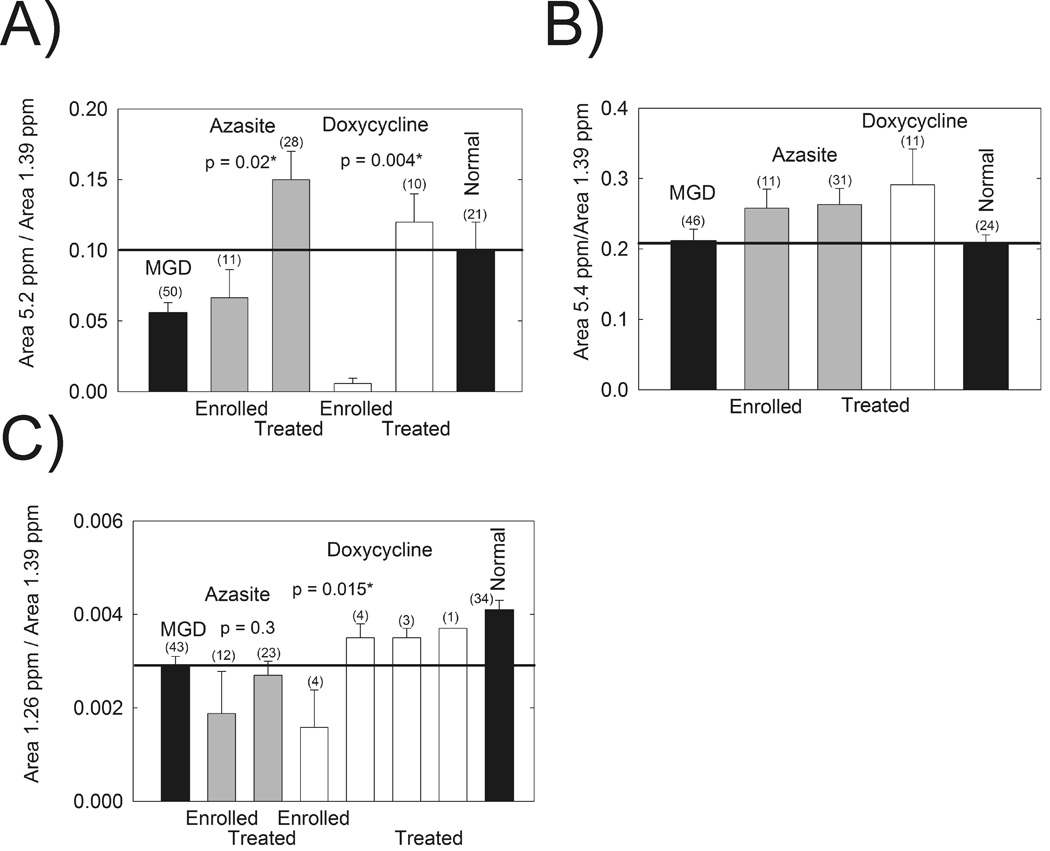
Data from the FTIR spectra of human meibum. Open bars: data are from a published azithromycin study.42 Filled bars: data from a larger study.42 A) Hydrocarbon order of Mn and Md at 33.4°C was not statistically different in patients after 8 weeks of oral doxycycline therapy (gray bars) and 1 month after treatment was stopped. More order indicates stiffer lipids with stronger lipid-lipid interactions. B) The phase transition temperatures of Md and Mn were not statistically different in patients after 8 weeks of oral doxycycline therapy (gray bars) and 1 month after treatment was stopped.