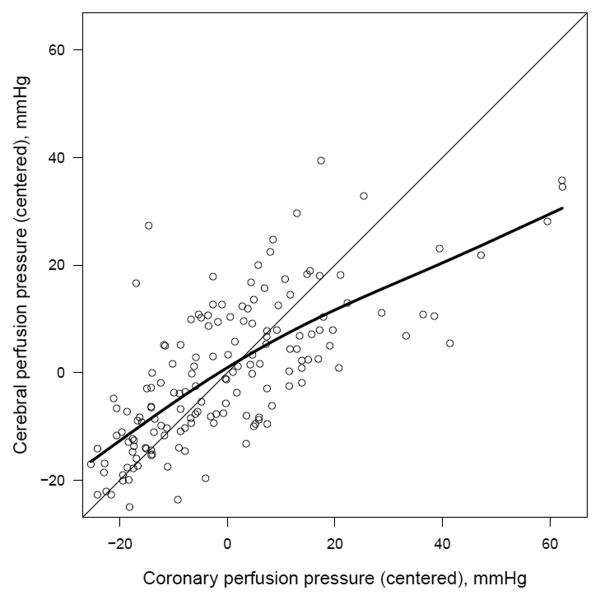
Figure 5.
Scatterplot of coronary perfusion pressure (CPP) and cerebral perfusion pressure (CerePP) residuals calculated utilizing a linear regression model for each variable adjusted for time; r = 0.76, P<0.001. Smoothing spline (bold line) demonstrates strong positive correlation between CPP and CerePP.

