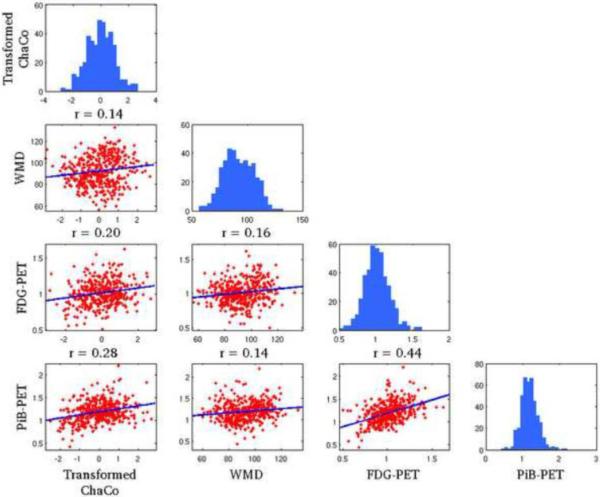
Figure 3. Pearson's correlations of the various imaging biomarkers on a regional basis.
Each of the parameters of interest are plotted against one another in the off-diagonal scatter plots and the histograms for each variable are given in the diagonal plots. Correlation values are indicated above each sub-plot.

