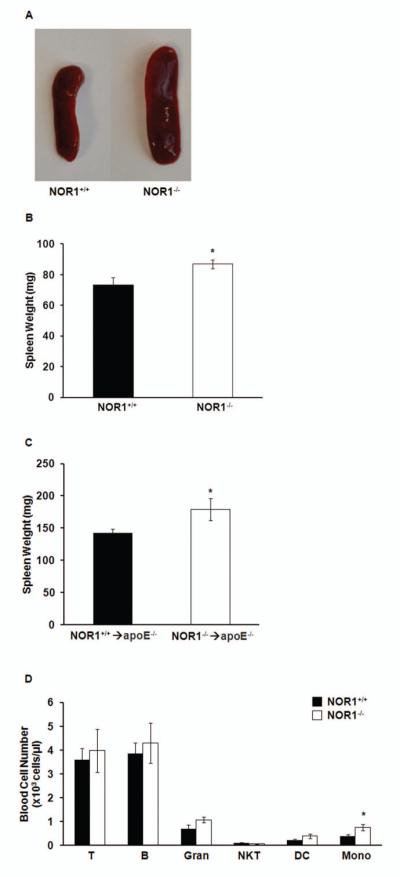
FIGURE 3.

NOR1 deficiency induces splenomegaly and monocytosis in mice. A. Representative images of spleens harvested from NOR1+/+ or NOR1−/− mice. B. Weight of spleens isolated from NOR1+/+ or NOR1−/− mice (n=9 per group). Values are mean ± SEM (*P<0.05). C. Weight of spleens isolated after bone marrow transplantation in NOR1+/+→apoE−/− and NOR1−/−→ apoE−/− mice (n=10 per group). Values are mean ± SEM (*P<0.05). D. Quantification of differential white blood cell populations in NOR1+/+ and NOR1−/− mice (n=6 per group) analyzed by flow cytometry. T, T cells; B, B cells; Gran, granulocytes; NKT, natural killer T cells; DC, dendritic cells; Mono, monocytes. Values are mean ± SEM (*P<0.05).
