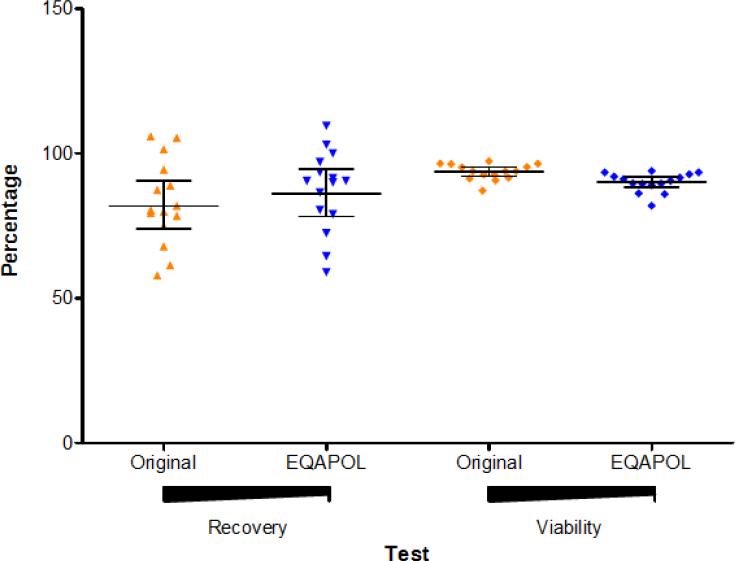
Figure 2. Percentage of Cell Recovery and Viability.
The percentage of cell recovery (left and triangles) and viability (right and diamonds) is shown for the samples as observed at time of sample collection (original and orange) and at time of sample screening for the EQAPOL (EQAPOL and blue). Each dot represents a sample. The lines represent the geometric means and 95% Confidence Interval.

