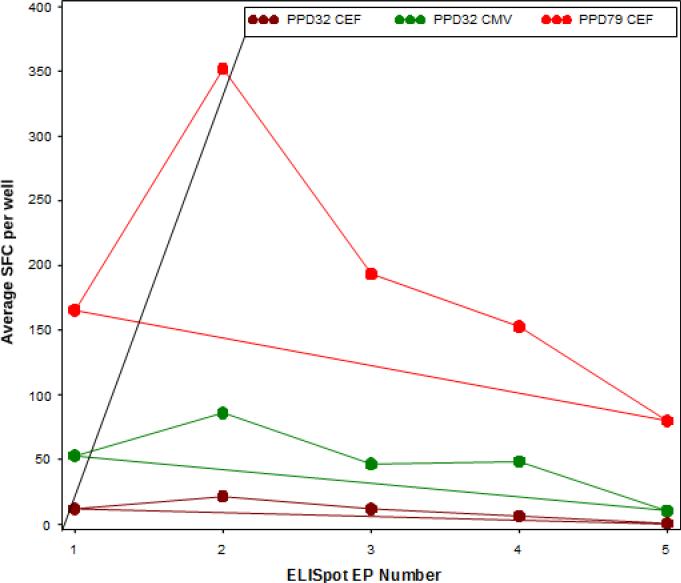
Figure 4. Longitudinal Mean Spots Forming Cell (SFC).
The lines represent the average SFC per 2×10⁵ reported over time by one of the sites for each EP. The SFC for sample PPD32 in response to CEF and CMV stimulation are reported in brown and green, respectively. The SFC for sample PPD79 in response to CEF stimulation are reported in red. The significant decreasing trends over time (EPs 1-5), all from Site 014, were calculated using mixed effects models.

