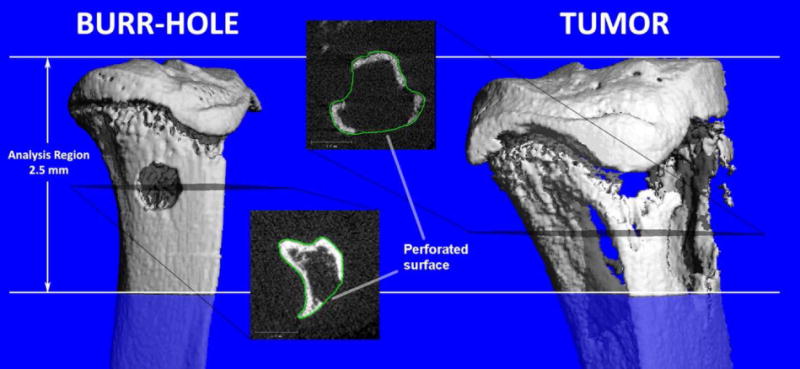
Fig. 3.

Visualization of bone defects in the proximal tibia of a mouse by in vivo micro-CT: a 0.7 mm diameter burr-hole (left), and an osteolytic bone tumor (right). The proximal 2.5 mm of the tibia was analyzed for both types of defects. The transverse gray scale images show breaks in the cortex arising from the defects. The operator provides manually drawn contours approximating an intact bone for the analysis. Figure reproduced from [105] with permission.
