
Fig. 4.
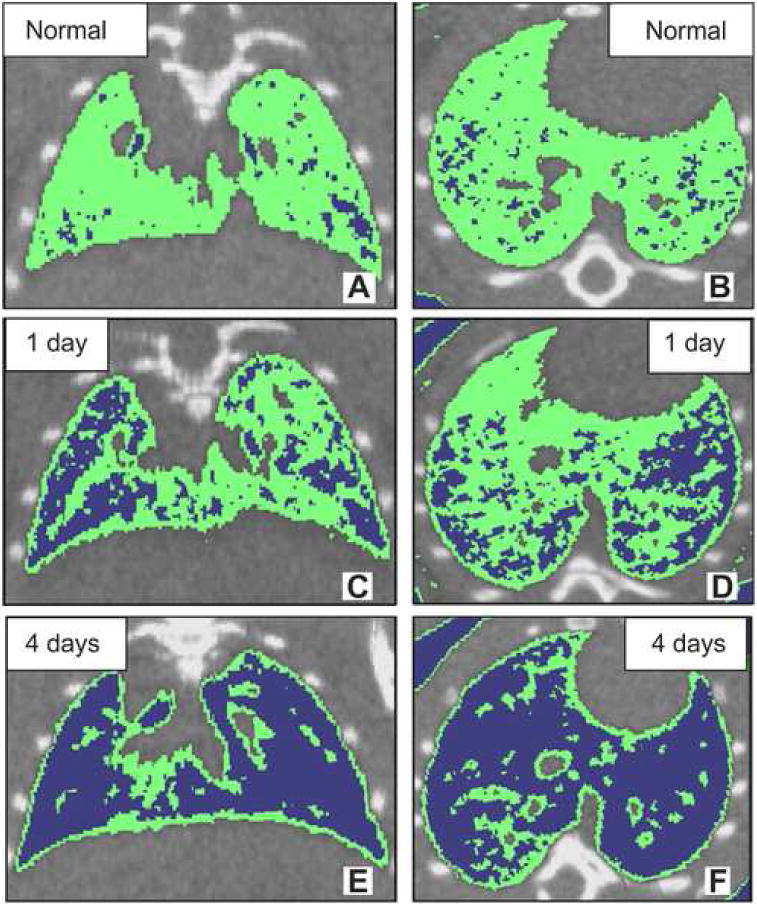
In vivo micro-CT in normal (A and B) and radiation-induced lung injury mice (C, D, E and F). Top panel: micro-CT images of normal mouse lung (A and B). Middle panel: micro-CT images of radiation-induced mouse lung injury at 1 day after x-ray exposure (C and D). Bottom panel: micro-CT images of radiation-induced mouse lung injury at 4 days after x-ray exposure (E and F). (A, C and E) transaxial slice orientation. (B, D and F) horizontal slice orientation. Areas of density between −200 to −500 HU on three-dimensional micro-CT slices were shown in green. Areas of density below −500 HU on three-dimensional micro-CT slices are shown in blue. Figure reproduced from [111] with permission.