
Fig. 9.
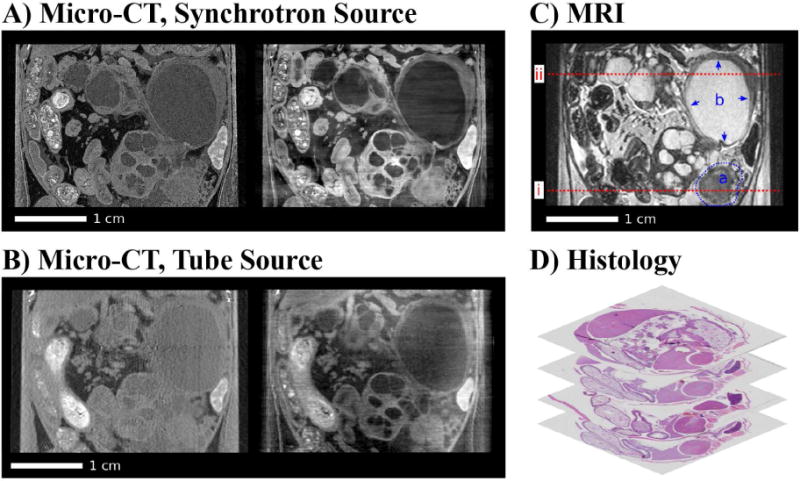
Coronal slices of the acquired multi-modal tomographic imaging data of the abdominal area in the mouse and histology. (A) Synchrotron: Attenuation-contrast image (left), phase-contrast image (right). (B) Tube source: Attenuation-contrast image (left), phase-contrast image (right). (C) MRI with highlighted solid tumor (a) and cystic lesion (b). (D) Stack of histology slices. All images are displayed on a linear gray scale and are windowed for best visual appearance of the solid tumor and cystic lesion. Figure reproduced from [182] with permission. All results shown in this figure were acquired ex vivo after whole-animal perfusion fixation with paraformaldehyde.