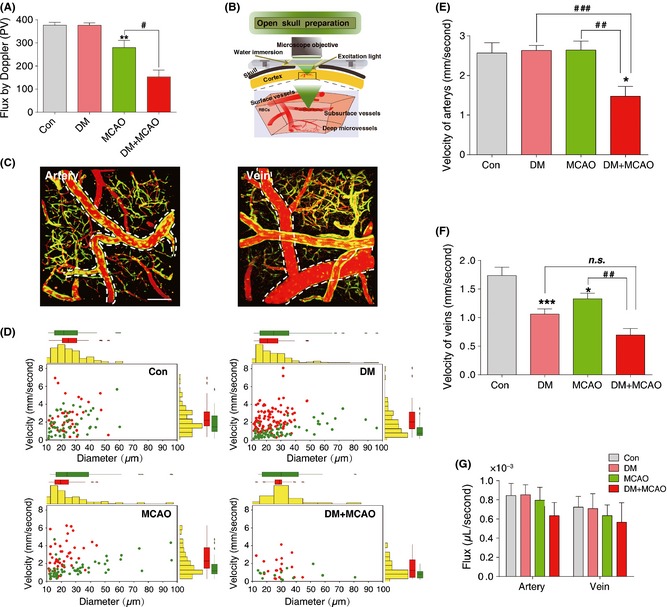
Figure 1.

Diabetes increases susceptibility to ischemic insults. (A) Changes in regional cerebral blood flow (rCBF) in control (Con) and diabetic (DM) mice after middle cerebral arterial occlusion (MCAO) using a laser Doppler flowmeter for measurements. The values read from the flowmeter directly and expressed as mean ± SEM (n = 6‐8), **P < 0.01; versus control mice; # P < 0.05 versus diabetes + MCAO mice. (B) In vivo imaging of blood flow by two‐photon laser‐scanning microscopy (TPLSM) through a cranial window. (C) TPLSM in conjunction with labeling of the blood plasma with Texas Red dextran is used for mapping the angioarchitecture as well as quantify the transport of individual red blood cell (RBC) in arteries and veins. Bar = 100 μm. (D) The changes in velocity of RBC plotted against diameter in artery (red) and vein (green) in control, diabetic, MCAO, and diabetic + MCAO mice were detected using TPLSM. Bar graphs display velocity of artery (E) and vein (F) in control (Con), diabetic (DM), MCAO, and diabetic + MCAO (DM + MCAO) mice. The data are expressed as the mean ± SEM (n = 6–8), *P < 0.05; ***P < 0.001 versus control mice; ## P < 0.01; ### P < 0.001 versus DM+MCAO mice. (G) Changes in volume flux (μL/second) in artery and vein in control, diabetic, MCAO, and diabetic + MCAO mice.
