
Figure 5.
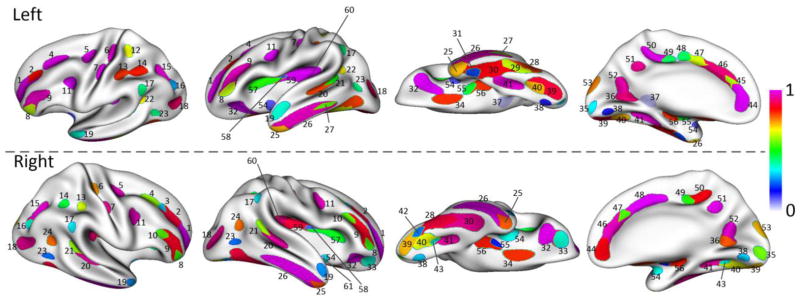
The concentration regions of the sulcal pits color-coded by their frequencies, overlaid on the partially inflated surface atlas at 1 year of age. The label for each of 61 concentration regions is assigned as follows: (1~4) superior frontal sulcus a, b, c and d; (5) junction between superior frontal sulcus and precentral sulcus; (6~7) central sulcus a and b; (8~10) inferior frontal sulcus a, b and c; (11) junction between precentral sulcus and inferior frontal sulcus; (12~13) postcentral sulcus a and b; (14~16) intraparietal sulcus a, b and c; (17) junction between intraparietal sulcus and superior temporal sulcus; (18) lateral occipital sulcus; (19~22) superior temporal sulcus a, b, c and d; (23~24) anterior occipital sulcus a and b; (25~27) inferior temporal sulcus a, b and c; (28~31) occipito-temporal sulcus a, b, c and d; (32~33) orbital sulcus a and b; (34) olfactory sulcus; (35~37) calcarine sulcus a, b and c; (38~43) collateral sulcus a, b, c, d, e and f; (44~50) cingulate sulcus a, b, c, d, e, f and g; (51) subparietal sulcus; (52) parieto-occipital sulcus; (53) junction between parieto-occipital sulcus and calcarine sulcus; (54~61) circular insular sulcus a, b, c, d, e, f, g and h. Note that, although most concentration regions are symmetric in two hemispheres, some concentration regions only appear in one hemisphere.