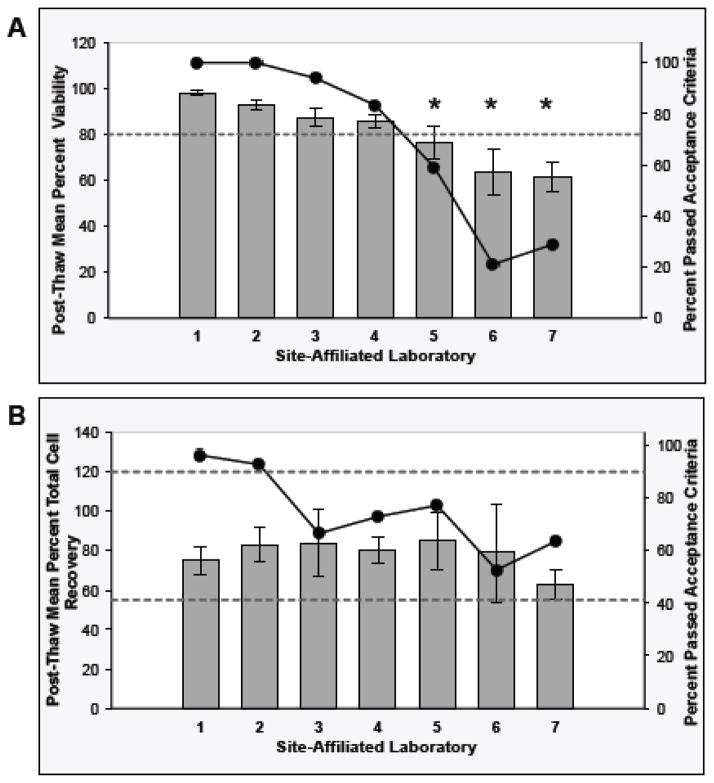
Fig. 2. Stage 2 - Cryopreserved PBMC Viability and Cell Recovery after Thawing at the Repositories.
The Day 1 PBMC post-thaw viability (Panel A) and total cell recovery (Panel B) QC results from PBMC preparations collected over five years from each site-affiliated laboratory are presented. The bars represent the raw data mean +/− 95% Confidence Interval (CI) for the QC results (left axis). The circle markers on the line represent the percent of the PBMC preparations from each site-affiliated laboratory that passed the acceptance criteria (right axis). The asterisks in Panel A indicate that the viability results differed between site-affiliated laboratories based on non-overlapping model-based 95% CI boundaries of the means. The upper and lower limits of the acceptance criteria are indicated by the horizontal dotted line(s) in each of the graphs. Acceptance criteria for PBMCs: post thaw viability ≥80%; post-thaw total cell recovery 55–120%.

