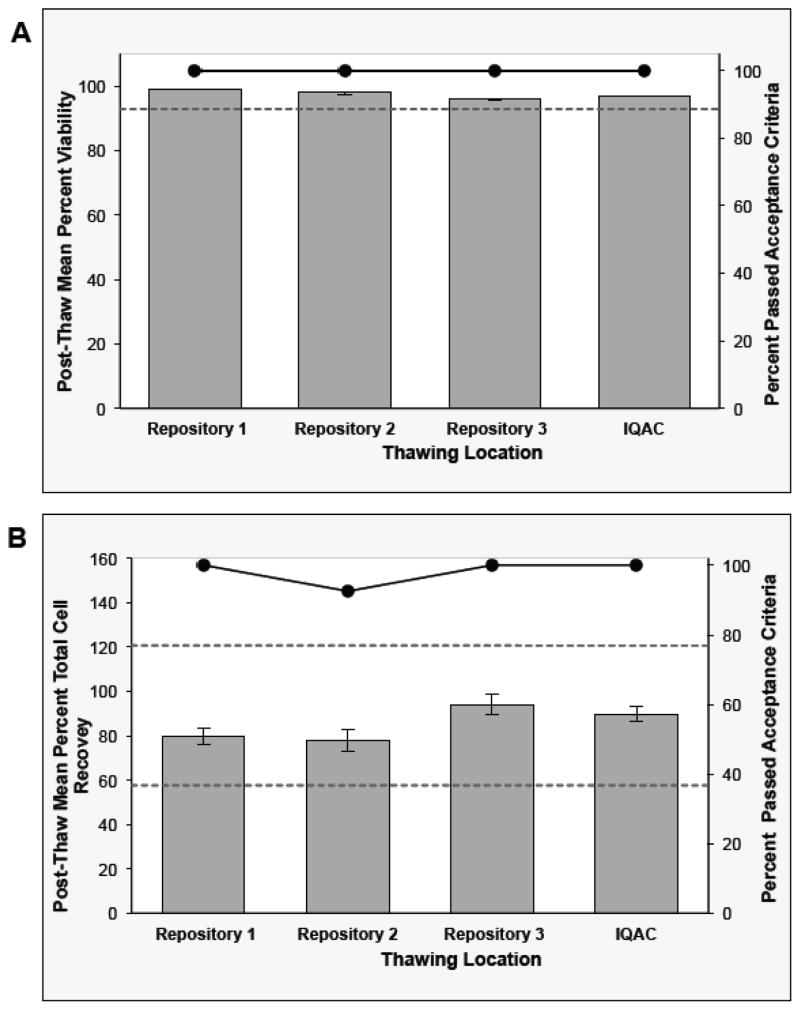
Fig. 3. Stage 3 - Sentinel Program for Long-Term Storage of Cryopreserved PBMCs at the Repositories.
The control sample post-thaw viability (Panel A) and Day 1 total cell recovery (Panel B) QC results collected over two years from each thawing location are presented. The bars represent the raw data mean +/− 95% CI for the viability results and the model-based mean +/− 95% CI for the recovery results (left axis). The circle markers on the line represent the percent of the control sample vials from each thaw site that passed the acceptance criteria (right axis) Acceptance criteria for the control samples: post-thaw viability ≥92.9%; post-thaw recovery 57.7–120.7%.

