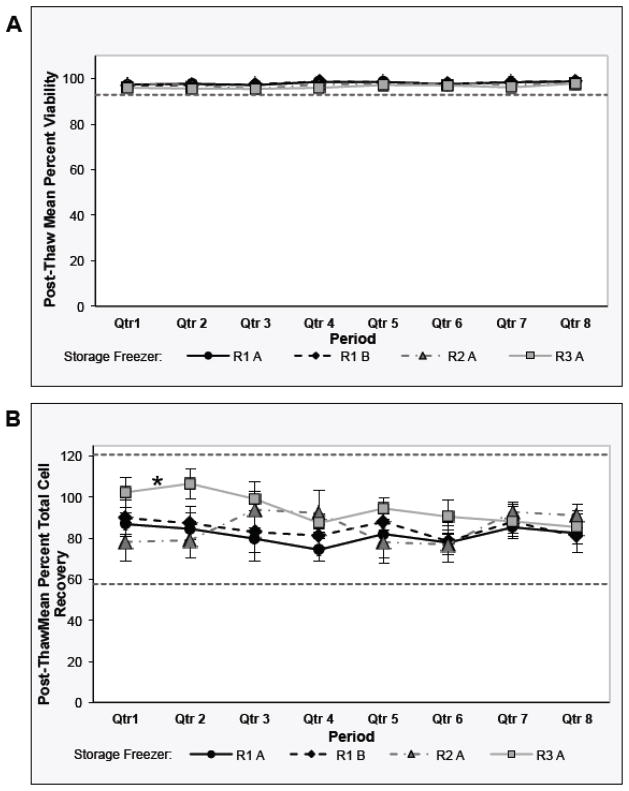
Fig. 4. Stage 3 - Sentinel Program for Long-Term Storage of Cryopreserved PBMCs at the Repositories: Analysis of Each Repository Freezer over Time.
Post-thaw viability (Panel A) and Day 1 total cell recovery (Panel B) QC results from the control sample vials stored in each repository freezer [Freezer A and B at the central repository 1 (R1 A, R1 B); Freezer A at the central repository 2 (R2 A); and Freezer A at the repository 3 (R3 A)] over two years are presented. The markers represent the raw data mean +/− 95% CI for the QC results. The asterisk in Panel B indicates that, by regression analysis, Freezer A at repository 3 control sample post-thaw recoveries changed over time (p=1.000). The upper and lower limits of the Acceptance Criteria are indicated by the horizontal dotted line(s) in each of the graphs. Acceptance criteria for the control samples: post-thaw viability ≥92.9%; post-thaw recovery 57.7–120.7%.

