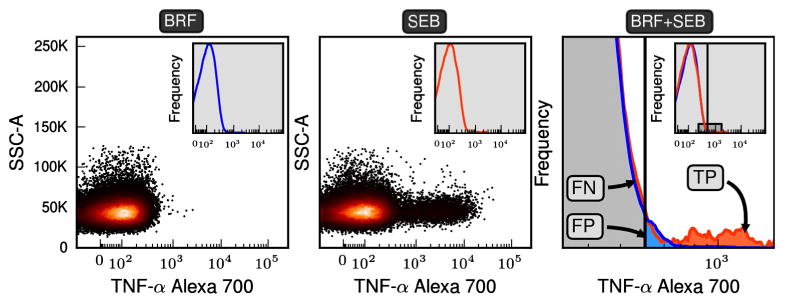
Fig. 1.

Specifying classification regions. The scatter plots of the first two panels are the fluorescent intensities for the gated events for TNF-α. To specify the classification regions needed for the Fβ method a negatively stimulated and a positively stimulated control are transformed into probability density functions (pdfs) (see insets of the first two panels). The pdf for positive (SEB) and negative (BRF) samples are overlaid in the third panel, where frequency is on the y-axis. The third plot expands the region shown in the inset. An arbitrary threshold is shown and events falling to the left and right of the threshold are classified as negative and positive respectively. Because we assume that the negative and positive samples are representative of their true populations we can define true positive, false positive, and false negative regions of event space. In the Fβ method a range of thresholds are searched until a threshold is found that optimizes the desired precision–recall trade-off specified by β. The CD3+CD8+ subset of 11C-EQAPOL-2 was used in this figure and the non-default parameters of β = 1.0 and θ = 3.0 were used to ensure all regions were easily visible.
