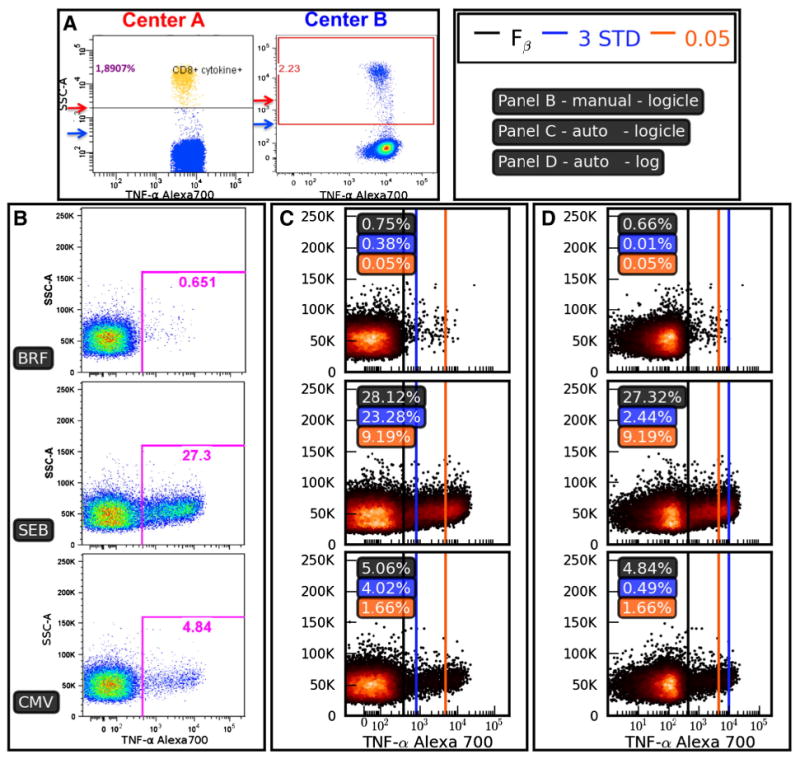
Fig. 3.

Inconsistencies in thresholding methods. Panel A: Two centers participating in the EQAPOL program evaluated the same sample using a common protocol to quantify the frequency of CD8+ cytokine positive events. Note that Center B places the threshold much closer to the negative population than Center A. Panels B–D show the setting of positivity thresholds for a sample from a donor with an endogenous CD4+ response that can be characterized by a high background even for the BRF-only negative control. Panel B shows thresholds set using manual analysis, while Panels C and D compare three different automated methods for setting the positivity threshold on the same data. Panel B: Results of manual threshold setting based on negative (BRF) and positive (SEB) controls. Panel C: Thresholds are calculated and drawn based on data that have been transformed using a biexponential (logicle) transformation. The ‘3 STD’ method sets the threshold at three standard deviations from the mean (blue line), the ‘0.05’ method sets the threshold at the 99.95% percentile (orange line), and the Fβ thresholding algorithm sets a threshold (black line) according to the methods described in this manuscript (β = 0.9). The ‘3 STD’ and Fβ methods give reasonable thresholds here, while the ‘0.05’ method excludes most of the positive response. Panel D: The data and thresholding methods are identical to Panel C, except that a logarithmic transformation has been applied. The dramatic shift of the blue line between Panels C and D shows the sensitivity to distributional assumptions that come with the ‘3 STD’ method. The data set used in Panels B–D was 11C-EQAPOL-1.
