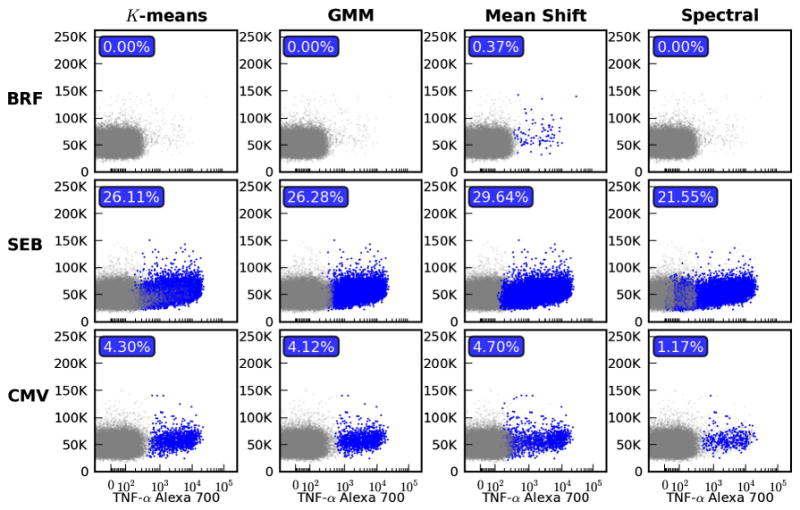
Fig. 4.

Using clustering to automate rare subset discovery. The donor and stimulated samples used in Fig. 3 are analyzed here using four different clustering methods. Each column represents a different algorithm: K-means, Gaussian Mixture Model (GMM), mean shift and spectral clustering. For each separate model all parameters were tuned to provide a single set of parameters for the three stimulations that yielded the best results. Within each subplot all clusters with a centroid that fell above the 99th percentile of the BRF stimulated sample are highlighted in blue and counted as positive in the calculation of percentage. (For interpretation of the references to color in this figure legend, the reader is referred to the web version of this article.)
