
Figure 2.
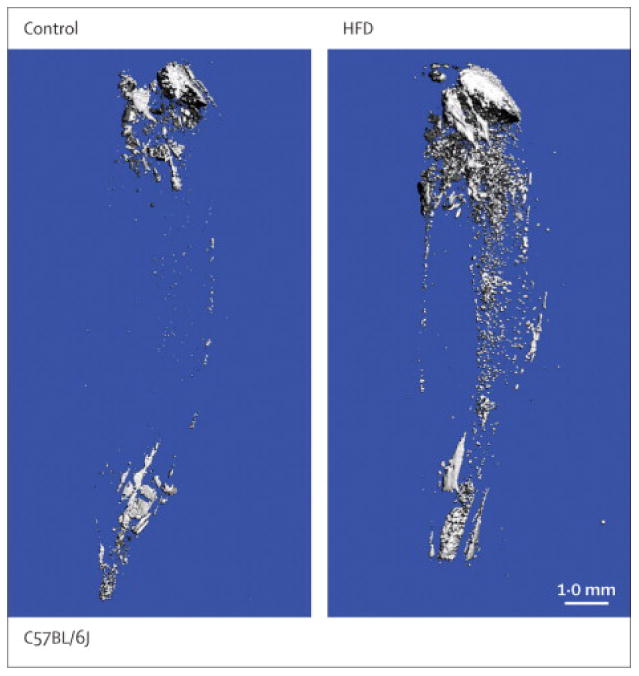
Osmium tetroxide (OsO4) staining of bone marrow fat visualized by microcomputed tomography. Representative images from the tibia show that compared to normal diet (Control, left panel), marrow adiposity is increased only marginally by high fat diet (HFD, right panel).