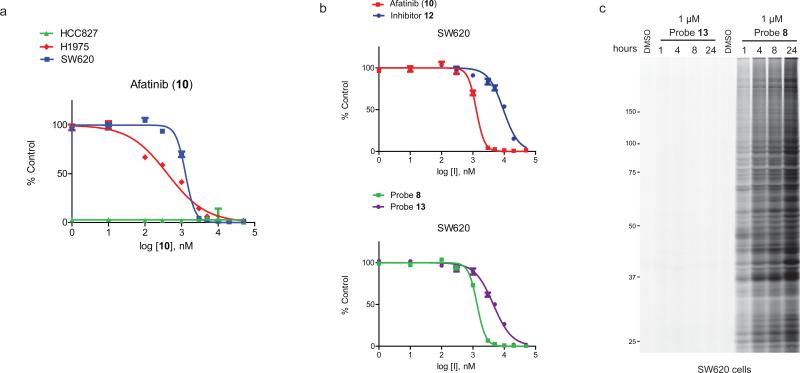
Figure 6.
Cytotoxicity and proteomic reactivity of DMAM-modified EGFR inhibitors. (a) Afatinib shows much greater cytotoxic activity in HCC827 cancer cells compared to H1975 or SW620 cancer cells. Data represent average values ± standard errors for triplicate measurements from two independent experiments (six total replicates). (b) Afatinib and probe 8 show greater cytotoxic activity in the EGFR-independent cell line SW620 than their unreactive saturated analogues 12 and 13, respectively (see Supplementary Fig. 9 for saturated analogue structures and additional cytotoxicity data). I, inhibitor or probe tested. Data represent average values ± standard errors for triplicate measurements from two independent experiments (six total replicates). (c) Probe 8, but not the saturated analogue 13 (in situ treatment with 1 μM of each probe), shows substantial time-dependent proteomic reactivity in SW620 cells as evaluated by gel-based ABPP. Gel-based ABPP experiments were performed in duplicate with consistent results.

