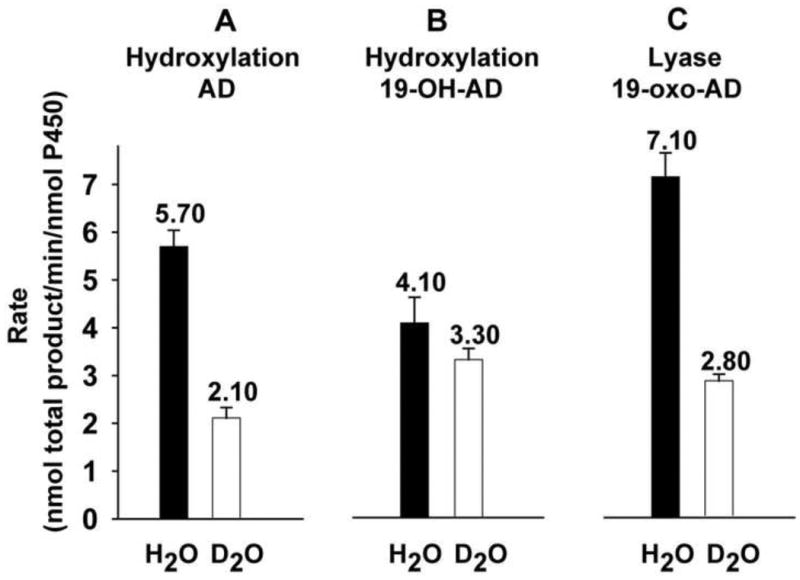
Figure 4.

Steady-state kinetic solvent isotope effects observed for hydroxylase (A and B) and lyase (C) CYP19A1 catalysis. The number on the bar represents the value of the activity. The error bar represents the standard deviation of 3-5 independent measurements.
