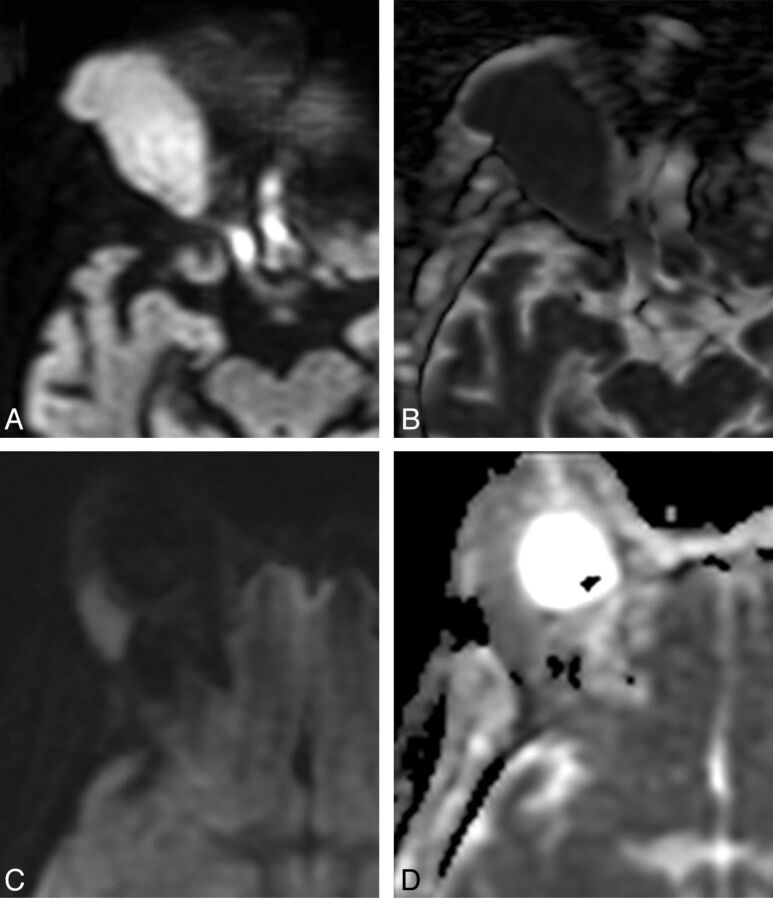
Fig 3.
Comparison between orbital lymphoma (A and B) and orbital inflammatory disease (C and D). A, Axial DWI shows a right orbital mass with marked hyperintensity. B, Corresponding axial ADC map shows dark signal, indicating low ADC and hypercellularity typical of lymphoma. ADC of this lesion was 0.65 × 10⁻³ mm2/s. C, Axial DWI in a different patient shows a lacrimal gland mass with less intense signal compared with A. D, Corresponding axial ADC map shows intermediate signal, brighter than adjacent brain parenchyma, reflective of the lower cellularity seen in orbital inflammatory lesions. The ADC of this lesion was 1.09 × 10⁻³ mm2/s.

