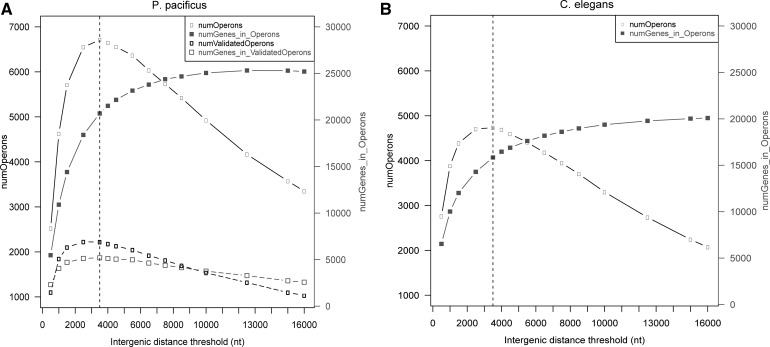
FIGURE 2.
Effect of different intergenic distance thresholds on the number of predicted operons and the number of genes within operons in P. pacificus (A) and C. elegans (B) suggests an optimal threshold at 3500 nt for predicting operons. The number of predicted operons (left y-axes, black curves with open boxes) in both species initially increases with the maximum intergenic distance allowed between consecutive genes within operons but starts to decrease beyond a 3500-nt cut-off (dotted vertical lines). The total number of genes predicted to be within these operons (right y-axes, gray curves with filled squares) increases with increasing intergenic distance threshold and saturates at ∼13,000 nt when almost all genes become part of predicted operons. In P. pacificus, the number of operons that could be validated using our RNA-seq data (dotted black curve, open black rectangles in A) also show the same trend as predicted operons, with a maximum at 3500 nt. Interestingly, the total number of genes included within these validated operons (dotted gray curve, open gray squares in A) also decreases beyond the 3500-nt threshold, which was thus chosen as the optimal threshold for computational prediction of operonic gene clusters.

