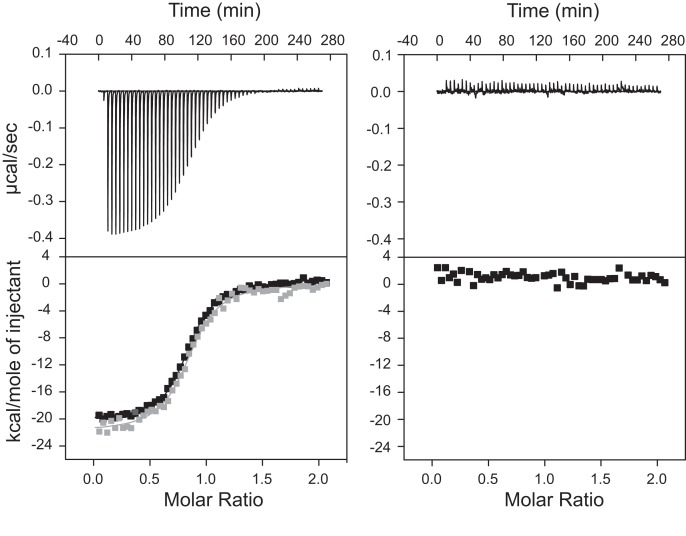
FIGURE 3.
ITC data analysis of wild-type SLV binding to SLIps at 20 mM MgCl2. The raw data of a representative titration experiment are shown on the left top panel and the corresponding control experiment (only buffer in the cell) is shown on the right top panel. The isothermal curves, which represent the integrated data of the above titration experiments, are shown on the bottom panels. On the left bottom panel, two isothermal curves of the titration experiment are shown, before (black) and after (gray) subtraction of the control experiment. They both yield the same KD value (0.24 μM). In the titration experiment, 100 μM of wild-type SLV was used in the syringe and 10 μM of SLIps was used in the cell.

