
Figure 5.
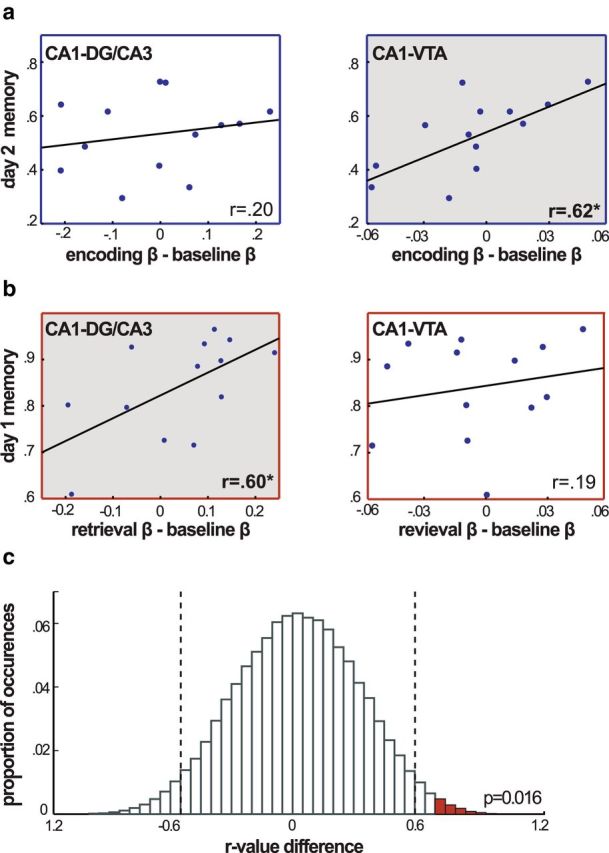
Memory performance and changes in functional connectivity. a, Corrected day 2 high-confidence associative memory is plotted against Encoding Task functional connectivity (Encoding − Baseline Math). CA1–VTA encoding functional connectivity was significantly correlated with subsequent memory performance (p = 0.02). b, Corrected day 1 associative memory is plotted against Retrieval Task functional connectivity (Retrieval − Baseline Math). CA1–DG/CA3 retrieval functional connectivity was significantly correlated with memory performance (p = 0.03). c, The proportion of randomly shuffled data that resulted in interaction terms of different magnitudes. Vertical dashed lines indicate the significance threshold of this nonparametric test at the α = 0.05 level, and red bars mark shuffles that resulted in an interaction term with a larger value than that which was obtained in the dataset. Two-tailed p = 0.016.