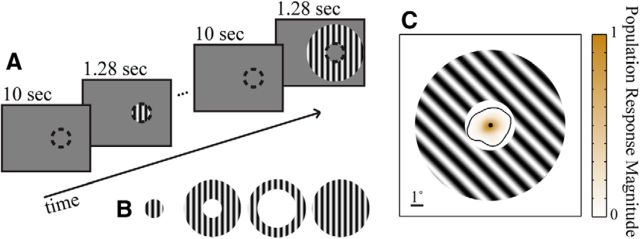
Figure 1.
A, Schematic time line of stimulus sequence. Grating stimuli were presented for 1.28 s, centered on the recorded RF area (represented by the dashed circle, not actually present in the stimulus). Gratings were separated by 10 s intervals of blank screens, except when noted otherwise in the text. B, Stimulus types. From left to right: 4° RF grating, near annulus, far annulus, and 12° grating (the 12° grating was included for 3 of the 5 array implants). C, Map of normalized aggregate RF area plotted with a superimposed near annulus for reference. The black contour line encloses 99% of all stimulus-evoked responses.

