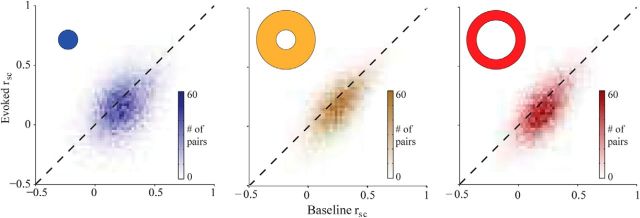
Figure 2.
Summary of rsc results for all pairs of neurons. Correlations during the evoked period are plotted against baseline correlations for the three stimulus types, indicated by the shape in the corner of the plot. Note that for each condition the distribution lies predominantly below the diagonal, indicating that correlations were weaker during the stimulus period than during the baseline period.

