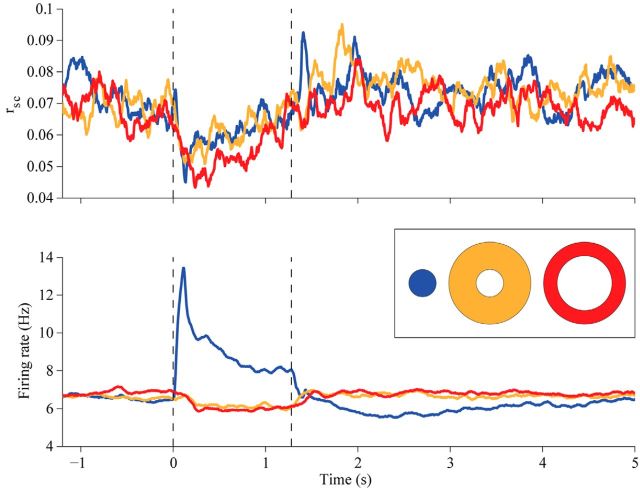
Figure 3.
Temporal dynamics of rsc and firing rates. Top, The value of rsc was measured in successive 100 ms time bins; data points are plotted at the midpoints of these bins. Blue line indicates responses to RF grating, yellow to the near annulus, and red to the far annulus. Vertical lines indicate the onset (at time 0) and offset (1.28) of the visual stimulus. Data are based on all 14,360 pairs. Bottom, Corresponding individual neuronal firing rates analyzed and presented as above.

